Monitoring and gathering statistics with JMX based jconsole and Yammer metrics
This post extends Yammer Metrics with Spring tutorial to demonstrate how the metrics can be monitored for the TradeEngineMain application.
Step 1: Run the TradeEngineMain java class created in the Yammer metrics tutorial.
Step 2: From the DOS command prompt, type jconsole
C:\Users\akumaras>jconsole
Step 3: The jconsole window pops up as shown below.

Step 4: You can monitor the statistics via the MBeans tab as shown below.
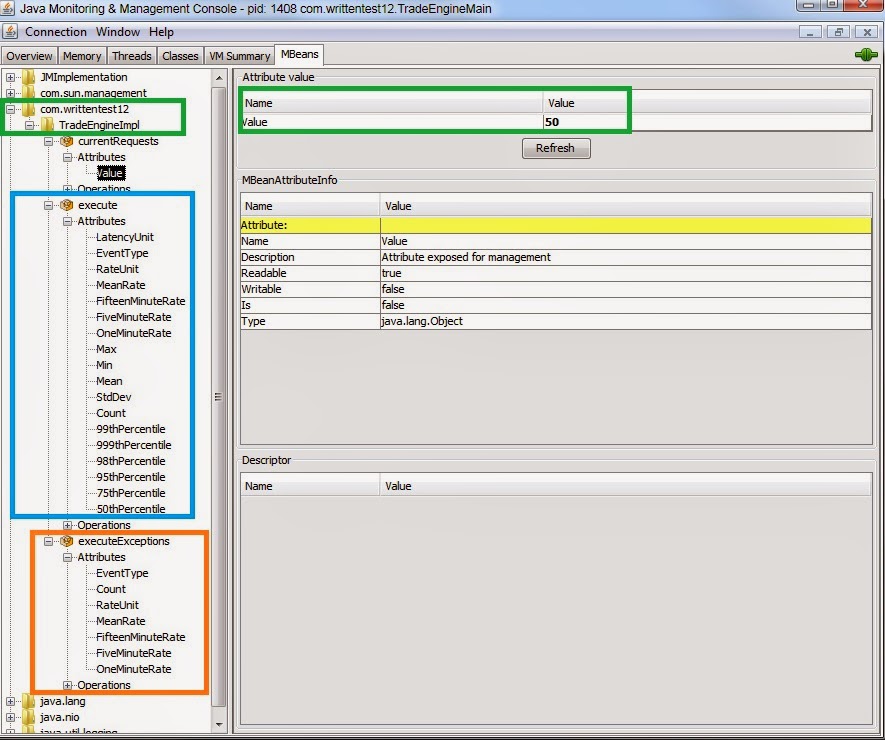
Drill down into each and observe the values.

With Yammer metrics, you can also output metrics to CSV, as JSON via RESTful web service, etc. It is quite a handy tool to monitor your applications.
Labels: JMX, Monitoring, Performance
posted by Unknown at
9/02/2014 12:21:00 AM
![]()
![]()

0 Comments:
Post a Comment
Subscribe to Post Comments [Atom]
<< Home